

AI can help you make correct decisions saving you costs while at the same time increasing your sales revenue. This article explains in simple terms how this is achieved using machine learning.
Introduction / Background
Regression analysis is a set of statistical methods used for the estimation of relationships between properties of an observation (subject). For instance if you are observing the growth of a child from infancy then you would like to check the relationship between the weight and height of that child. The child becomes the subject, the weight and height becomes the variables.
If you are studying how the weight changes with height then the weight becomes the dependent variable and the height becomes the independent variable. This means you can build a regression analysis that is able to predict the weight of a child given the height.
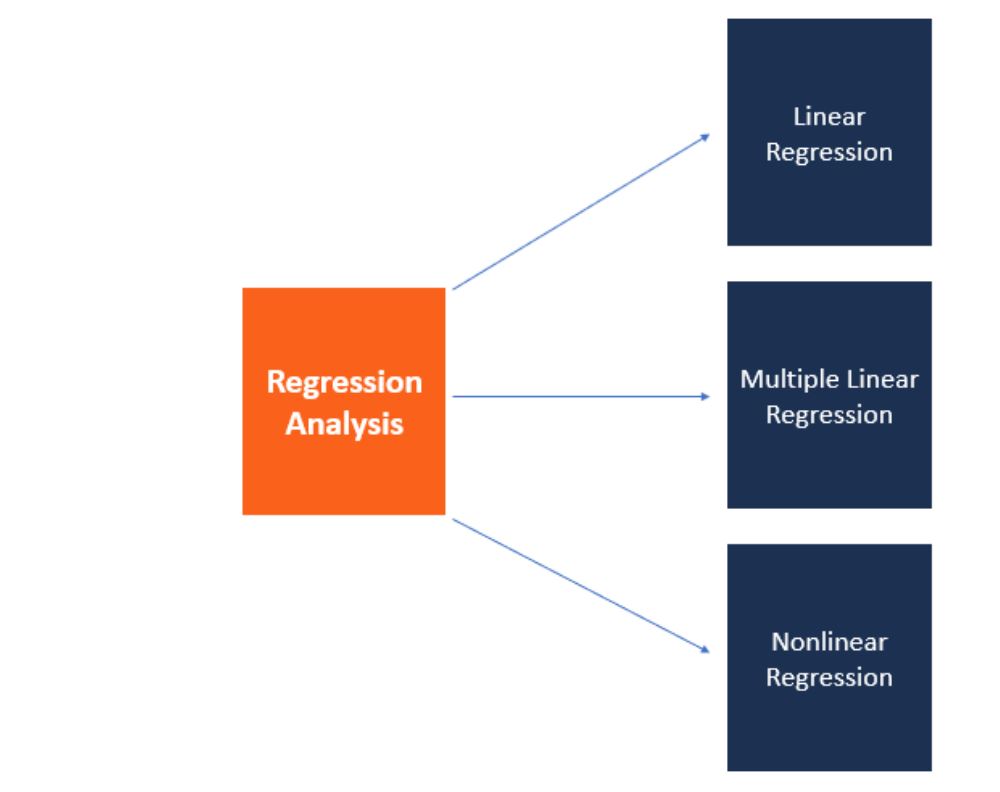
Linear regression analysis means there is a linear relationship between the dependent variable and the independent variable. Non-linear regression analysis means there is no linear relationship between the dependent and the independent variables. Meaning the relationship between the dependent variable and the independent variables is a complex one.
When studying how several independent variables affect a single dependent variable in a linear relationship then this is called a multiple linear regression. Using the same example, say you want to study how the weight changes with height and age, we will be having two independent variables affecting the one dependent variable which is the weight.
When studying how a single independent variable affect another single dependent variable in a linear relationship then this is called a simple linear regression problem and that will be our focus of entry in this blog.
In this article i will use a simple linear regression problem to explain how a business problem can be solved using simple linear regression. But just before i start, let me highlight some of the assumptions of linear regression:
Linear Regression
Using a hypothetical use case, we will assume XYZ Company dealing in cloths and cloth wear has both a mobile app and a website from which the customers place orders remotely. As the manager of this company you can use AI to arrive at a scientifically backed decision.
Business Problem
As the general manager of XYZ Company, I spend so much money in marketing cloths through mobile app and website but we are running low on budget. Where should i focus on the marketing campaign.
Data Available
Over the past one year, we have collected the below data for every customer:
|
Data Collected |
Description |
|
Email Address |
This is the customers emails |
|
Address |
This is the physical and postal address |
|
Avatar |
This is the avatar for the customer |
|
Average Session Length |
This it the average session length by the customer on both the app and the website |
|
Time on App |
This is the time taken by the customer on the app for the entire year |
|
Time on website |
This is the time taken by the customer on the website for the entire year |
|
Length of Membership (Years) |
This is the duration of membership by the customer |
|
Yearly Amount Spent (Each Year) |
This is the amount spent in a year by the customer |
Analysis
Because we are interested in sales by the customer, we shall now be interested to know how the other pieces of information (Email Address, Address, Avatar, Average Session Length, Time on App, Time on website, Length of Membership(Years) affect the Yearly Amount Spent)
By being able to predict, with a very high level of accuracy, the yearly amount spent then we shall have been able to get the formula that combines how each of the other pieces of information contribute to the yearly amount spent.
Technique Used for Prediction
This kind of problem involves determining the value of an output (what we call the prediction) as a function of the weighted sum of the input (these are the pieces of information made available and can be used to generate the output)
The technique used for this kind of prediction is known as Regression technique and the overall objective is to determine by how much each of the input information contributes to the yearly amount spent (output). Meaning if we choose Average Session, Length, Time on App, Time on website and Length of Membership (what we will call the input variables) as the information that is to be used to make the prediction (what we will call the output variable), then using Regression technique, we will be able to determine by how much each of the input variables contribute to a good prediction of the Yearly Amount Spent (output variable). These are what we call coefficients. So we are looking at identifying the coefficients of each of the input variables then we select the input variable with the greatest coefficient.
Types of Regression Techniques
|
Terminology |
Description |
|
Input variable |
These are the independent pieces of information that you believe contributes to the accurate production of the desired output. This is also called the independent variable. |
|
Output variable |
This is the information generated through a combination of the input variables by way of a prediction. This is also called the dependent variable of the target variable |
Linear Regression is a supervised learning algorithm in machine learning that supports find the linear correlation among variables. The result or output of the regression problem is a real or continuous value.
Other Real-world Examples of Regression
The below represents examples where regression technique may be used:
Sources